Building Information Modelling (BIM) is a digital process that enables construction and infrastructure teams to create, manage, and share detailed project information throughout a building’s lifecycle.
BIM has changed how Australian construction and infrastructure teams deliver projects. But it’s only as useful as the clarity behind it, and that’s where BIM LOD levels come in.
If you’ve ever opened a BIM model and wondered whether the information can actually be trusted for decision-making, LOD is the answer.
What is the Level of Development in BIM?
The definition of LOD (Level of Development) in BIM refers to the amount of information, detail, and reliability contained within a model element at a specific stage of a project.
It is a standardised framework that defines how much information a BIM model element contains, and how reliable that information is at a given project stage.
LOD isn’t about how good the 3D model looks. It’s about what decisions can be made from what’s in the model. A wall at LOD 100 tells you roughly where a wall exists. A wall at LOD 400 tells you exactly how it’s built – materials, fixings, tolerances, and all.
Developed by the American Institute of Architects (AIA) and widely adopted across Australian BIM workflows (including ISO 19650-aligned projects), LOD levels run from 100 through to 500, each tied to a specific project phase.
So, when asking what level of development in BIM is – understanding LOD and BIM LOD levels is essential for project managers, engineers, and digital delivery leads who want clear expectations from their BIM provider. F
or context on how BIM compares to traditional documentation, see our guide on BIM vs traditional CAD.
BIM LOD Levels Explained: 100 to 500
LOD 100 – Conceptual
- Project Stage: Pre-design / feasibility
- What it represents: Overall massing, orientation, and location. Elements are symbolic – think a block representing a building, not a building.
- Real-world example: A wall is represented as a generic volume with no thickness or material. A roof is an implied surface. MEP systems may not appear at all.
- Used for: Feasibility studies, site planning, early cost estimating (typically ±30% accuracy), and initial stakeholder visualisation.
LOD 200 – Approximate Geometry
- Project Stage: Schematic design
- What it represents: Elements are modelled as generalised 3D shapes with approximate size, quantity, and location. Not yet construction-ready.
- Real-world example: A structural column appears with a rough diameter and height, but without connection details. A roof system shows approximate slope and coverage area. MEP zones are blocked out but not routed.
- Used for: Design development reviews, early-stage clash avoidance, and coordination between disciplines at a high level.
LOD 300 – Precise Geometry
- Project Stage: Design development / construction documentation
- What it represents: Elements modelled with accurate geometry, quantity, size, shape, location, and orientation – enough detail to produce construction documents.
- Real-world example: A wall shows specific thickness, layer composition (e.g. 90mm stud, 13mm plasterboard, vapour barrier), and exact position. MEP ducts are sized and routed through modelled ceiling spaces.
- Used for: Coordination drawings, regulatory submissions, and construction scheduling. This is where clash detection delivers serious value.
LOD 350 – Construction Coordination
- Project Stage: Detailed design / pre-construction
- What it represents: LOD 300 geometry plus interfaces and connections between systems – how elements interact with adjacent components.
- Real-world example: A structural beam includes connection plates and bolt hole locations. Ductwork includes hangers and clearances. Wall assemblies show fire ratings and acoustic separation details.
- Used for: Trade coordination, subcontractor packages, and pre-construction sequencing. LOD 350 models reduce RFIs by up to 60–70% compared to traditional CAD workflows, with potential rework savings of $80,000–$180,000 on a 15,000 sqm project.
LOD 400 – Fabrication-Ready
- Project Stage: Construction / fabrication
- What it represents: Full fabrication, assembly, and installation details. Elements are modelled to the level required to manufacture or install without further interpretation.
- Real-world example: A steel column includes exact weld specifications, bolt patterns, and tolerances. Roof panels are dimensioned for shop drawing production. MEP equipment is modelled with exact product geometry (manufacturer-specific).
- Used for: Shop drawings, prefabrication, and on-site installation guidance. Increasingly relevant for modular and prefab construction common in Australian commercial and infrastructure projects.
LOD 500 – As-Built / Record Model
- Project Stage: Post-construction / facility management
- What it represents: The model reflects actual, verified conditions as constructed on site. Not an estimate – a documented record confirmed through site verification.
- Real-world example: Walls, roof systems, and MEP installations are modelled exactly as they were built, including any field deviations from the design model. For existing buildings, this is often achieved through scan-to-BIM workflows using 3D laser scanning to capture as-built conditions with millimetre-level accuracy.
- Used for: Facilities management, ongoing maintenance scheduling, future renovations, and asset handover documentation. LOD 500 models are the foundation of a building’s digital twin.
LOD Comparison Table
LOD | Project Stage | Geometry | Data Attached | Typical Use |
100 | Feasibility | Symbolic massing | Minimal | Cost estimates ±30%, stakeholder sign-off |
200 | Schematic design | Approximate 3D | Basic parameters | Early design coordination |
300 | Design development | Precise 3D | Full design data | Construction documents, clash detection |
350 | Pre-construction | Precise + interfaces | Interfaces included | Trade coordination, RFI reduction |
400 | Construction | Fabrication-ready | Manufacturer data | Shop drawings, prefabrication |
500 | Post-construction | As-built verified | Operations data | FM, asset management, digital twins |
Common Mistakes with BIM LOD Levels
Getting LOD wrong is one of the most frequent and avoidable causes of BIM project failure in Australia. Here’s what to watch out for:
1. Specifying LOD 500 for everything
LOD 500 is post-construction verification. Requiring it across all elements from the outset dramatically increases cost without proportional value during design. Match the LOD to the project stage.
2. Confusing LOD with visual quality
A photorealistic render does not mean high LOD. LOD is about data reliability, not appearances. Teams sometimes invest in visuals while the underlying model data is still at LOD 200.
3. No LOD matrix in the BIM Execution Plan (BEP)
Without a documented LOD matrix, disciplines work with different assumptions. A structural engineer at LOD 350 and a services contractor at LOD 200 will produce models that appear coordinated but aren’t.
4. Skipping LOD 350
Many teams jump straight from LOD 300 to LOD 400, missing the critical trade coordination step where the majority of costly clashes are identified and resolved.
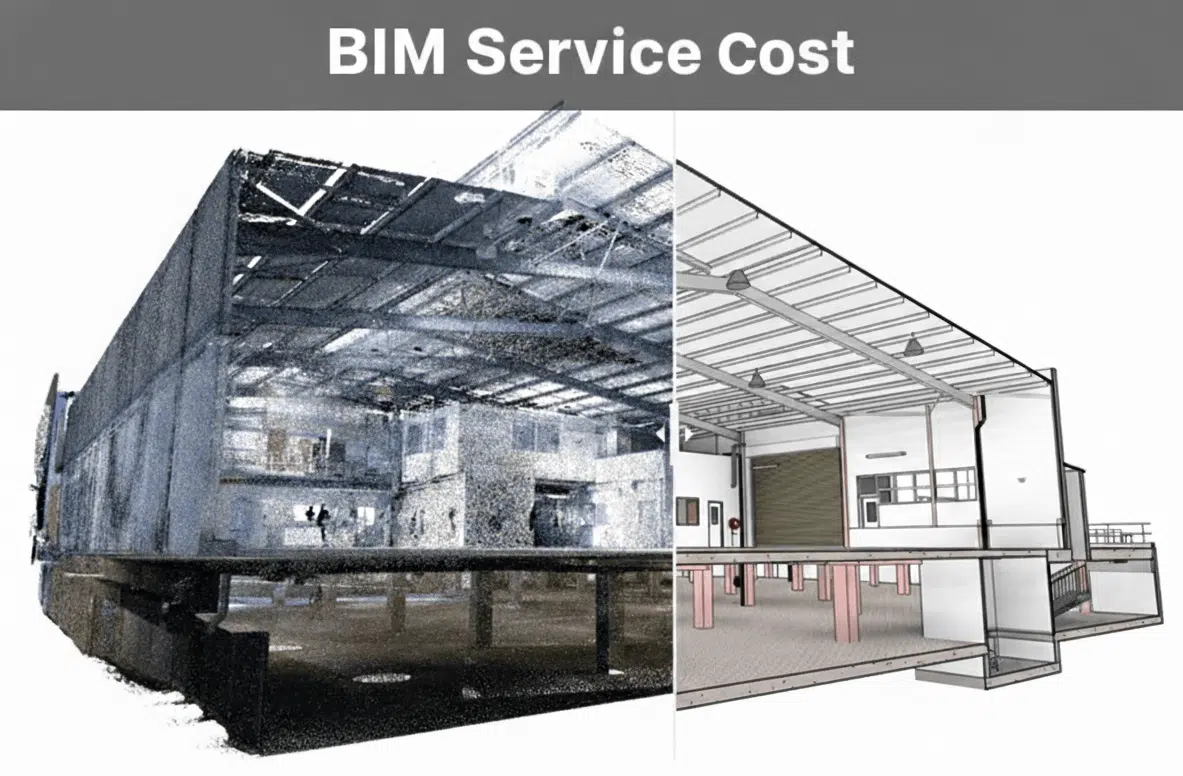
5. Assuming a scan equals LOD 500
A raw point cloud is not an LOD 500 model, it’s the source data. LOD 500 is achieved when that point cloud has been processed and modelled into a BIM environment, a workflow Avian specialises in end-to-end.

How Avian Delivers Across LOD Levels
At Avian, our BIM and 3D modelling services are built around delivering the right level of detail for each project phase – not overkill, not underdone.
We capture existing conditions through high-accuracy laser scanning across Melbourne, Sydney, and Brisbane, then process that data into Revit, Civil 3D, CAD, or Navisworks models tailored to the LOD your project requires. Whether you need schematic coordination models at LOD 200 or verified as-built documentation at LOD 500, we work to your BIM Execution Plan and ISO 19650 requirements.
The benefits of BIM services compound at every stage, but only when LOD is applied correctly from the outset.
Ready to Define Your LOD Strategy?
Whether you’re scoping a new commercial build, planning a renovation, or delivering infrastructure across multiple disciplines, getting your LOD framework right at the start makes everything downstream easier, faster, and less expensive.
Talk to the Avian team about your project. We’ll help you define an LOD approach that matches your schedule, budget, and delivery goals.